Tooltip Actions
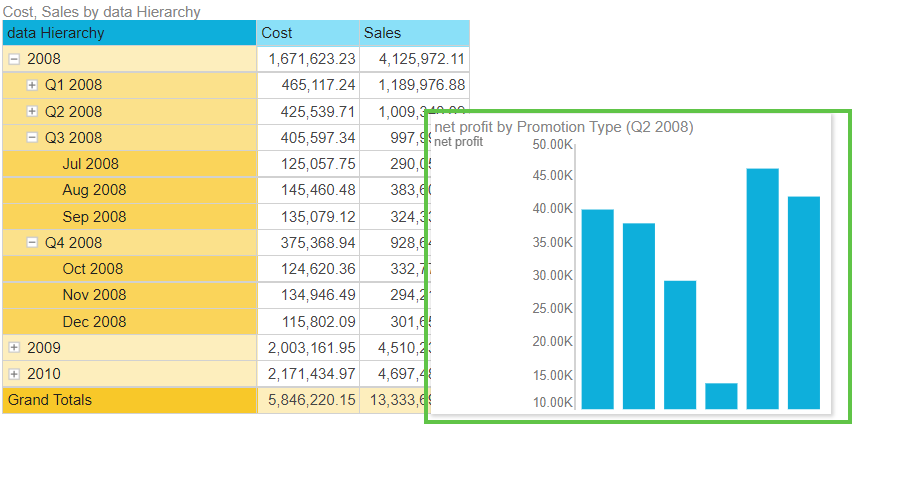
Hovering over the relevant measures, the tooltip will appear displaying the corresponding report. The report displayed in the tooltip will be filtered by the hierarchies contained in the current query; this means both reports must come from the same database, or have cross model mapping applied.
If you choose to "include context" in the tooltip, it will also be filtered by any slicers or interactions applied to the current query.
Tooltip actions that are applied to a data discovery will also appear in runtime of presentations containing that query.
Build a Tooltip Action
Tooltip actions can be created from Discover and Present.
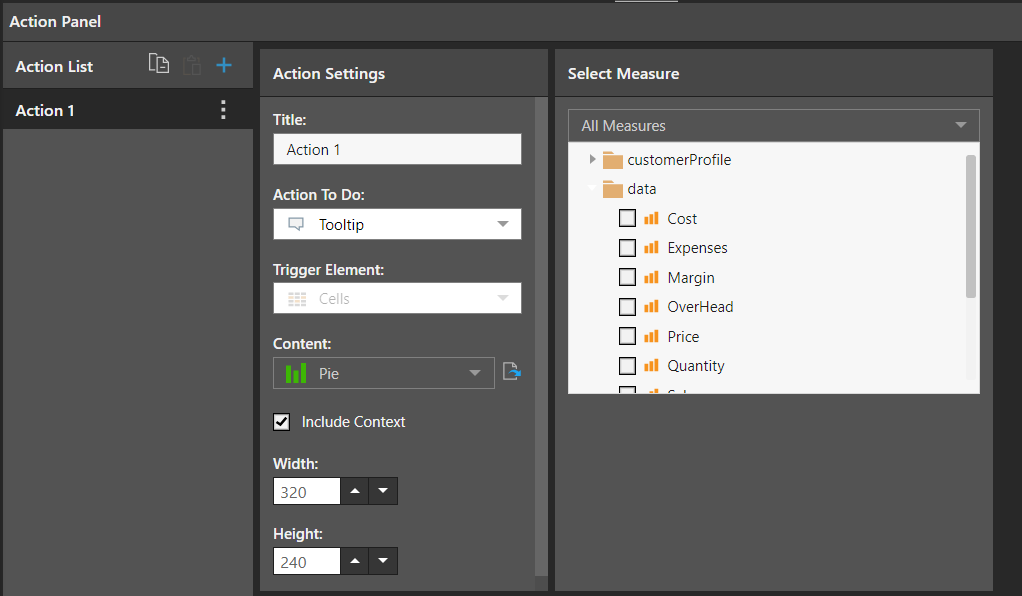
To build a tooltip action, start by opening the Action Panel and creating a new action.
- Set Tooltip as the "action to do".
- Open the Content drop-down; select the required data discovery or presentation from the Content tree.
- Enable "Include Context" to filter the report tooltip by slicers and interactions performed in the current query (measures will not be injected into the tooltip).
- Set the width and height of the tooltip container as needed; this will also determine the size of the report in the tooltip.
- If you've chosen a presentation as the tooltip content, enter the name of the relevant presentation target in the "Target" field.
- Choose the measure that should drive the tooltip action. When you hover over the given measure column in the query, the tooltip will appear. You can select any single measure. Or make no selection from the Measure tree to choose "All Measures"; in this case, the tooltip will be driven by every measure in the query.
Example. Tooltip Action in a Grid
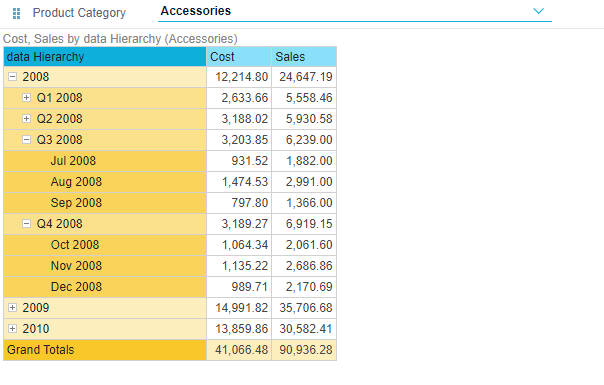
In this example, we have a grid showing Cost and Sales by Date hierarchy, and filtered by a Product Category slicer:
A tooltip action was created containing a pie chart, with context included, and driven by all measures in the current query:
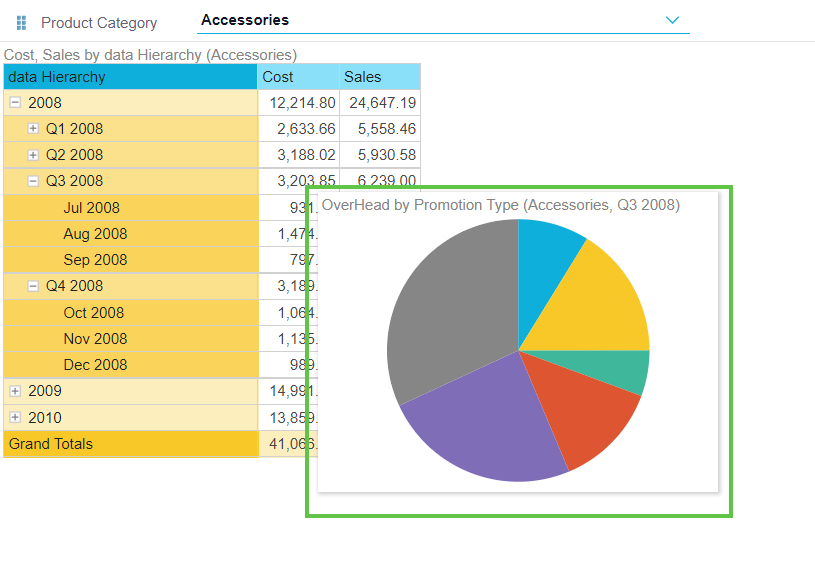
When hovering over the measure columns in the current query, the tooltip appears displaying the selected pie chart. The tooltip breadcrumbs show that the pie chart is filtered by the current query dimensions: Accessories, Q3 2008:
Example. Tooltip Action with a Presentation