Interactive Query Functions
Right-click on the cells, columns, headers, legends or segments of the visual to access interactive query functions. The pop-up menu differs depending on whether a member or value is selected:
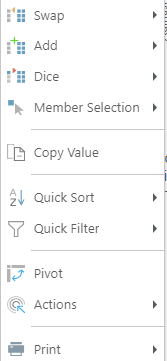
Functions
- Drill Down, Drill Up, and Drill to Level - Drill functions allow users to move between different levels of a user hierarchy
- Expand and Collapse - Expand and Collapse allows users to hide and show multiple levels of the hierarchy in a grid visualization
- Dice, Add, and Swap - Dicing allow users to 'drill across' from a chosen element into another hierarchy. The Add and Swap menus offer variations of Dice, to inject and replace hierarchies.
- Member and Data Point Selection - Selection tools allow users to easily and intuitively select elements and data points for analysis directly from visualizations
- Quick Sort - Sorting allows the user to choose the order in which data and items are presented in a visualization
- Quick Filter - Filtering allows the user to numerically filter data and items in queries
- Pivot - Pivot allows the user to rotate selections between drop zones in your query design
- Print - Totals allow users to add totaling to their grids to add context and information to the report.
- Copy - Copy the data point or data in a grid to the clipboard so it can be pasted into a spreadsheet or document.
- Actions - Actions allows users to launch actions that have been configured.
Presentation Menus and Panel Tools
Presentation Menu Options
Access the presentation menu from the hamburger menu in the upper left-hand corner of the slide when viewing the presentation in runtime.

- Re-Run Queries: re-run the queries in the visuals.
- Undo: undo the previous action.
- Redo: redo the previous action.
- Reset: undo all changes to reset the presentation - be sure to reset before exporting, as interactions at runtime will be reflected in the exported presentation.
- Multi-Highlight Mode: enable cross-highlighting of visuals by multiple member elements or data points.
- Print: open the Print & Export dialog.
- Help: go to the user help.
Panel Tools
When a presentation is launched in runtime, a selection of panel tools is available for each visual.
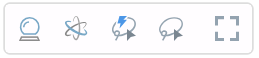
Smart Insights: Generates AI-automated analysis of a given query, with the output returned in natural language.
Natural Language Querying Chat: (NLQ) Allows users to easily interact with visualizations in an intuitive way with plain English.
Auto Lasso Tool: use the dynamic lasso selection tool if cross-filters for your visuals have been configured. The affected visuals will be filtered by the selected data points.
Lasso Selection Tool: use this to select multiple data points, and then interact with them
Full-Screen: click the full-screen icon to full-screen the specified visual
Other Topics
- Query Interactions
- Presentation Menu in Present